Investor Objectives
Investor objectives can be broken down into at least two major dimensions, income or growth in wealth such that future income will be derived. There may be other specific objectives like protection from inflation or being able to save enough for grand children’s college, but it all boils down to the desired timing of the future wealth derived by not spending now and investing in assets that might provide a return. Generally early career people want to focus more on long term growth, while older career types want to look for higher income and less growth. It is impossible to have both, since the market bids for these assets and those with more growth potential will be bid up relative to any current income. For this reason, many stocks pay no dividends at all, since they want to reinvest and maximize growth potential. Other stocks pay relatively high dividends while providing minimal growth.
Where should one invest?
Many investors already have savings accounts, CDs at banks, and own a home, all of which is part of their personal portfolio. They may also own a whole life insurance policy with a cash value and possibly less liquid investments like stamps, art, antiques, or classic cars. But the entire spectrum of our portfolios might include cars, collectibles, real estate, savings accounts, CDs, bonds, stocks or more. Generally, we divide up our portfolio into that which is easily liquidated and that which is less liquid. The most liquid investment would be a savings account or money market fund. Stocks tend to be very liquid. Real estate investments are less liquid and may take months to convert to cash. How one allocates their portfolio requires knowledge of the financial needs and optimal timing of the household, as well as their risk tolerance. This requires an expert of some sort, such as a CFP, certified financial professional, a CFA, certified financial analyst, possibly am SEC registered investment advisor, or self-education in economics, finance, market systems and within each investment type of interest.
We also divide up stocks into “growth” or “value” based on a simple formula, the average price to earnings ratio or PE Ratio. Those stocks in the highest 50% of all stocks (higher PE ratios) within any group or index are called growth stocks are called growth stocks, where the higher the PE ratio the more the market feels they offer growth. The bottom half of the PE ratio list will becalled value stocks with the lower PE ratio stocks being more conservative investments with less growth prospects. For example, a stock like a chip maker would be among the growth stocks and a utility company or a REIT (real estate investment trust) would generally be among the value stocks. We also divide stocks into various groups, like ETFs, see below, or by index or country or exchange or whether they pay dividends or not, or whether they trade in US dollars or other currency.
There are some investments that pay nothing in dividends and have no sales data available on which to judge future growth, for example cryptocurrencies or gold. These are not investments we follow or provide information about.
Return relative to risk using a Sharpe type ratio
Economist William F. Sharpe proposed the Sharpe ratio in 1966 as an outgrowth of his work on the capital asset pricing model (CAPM), calling it the reward-to-variability ratio. Sharpe won the Nobel Prize in economics for his work on CAPM in 1990. We use the return to risk ratio in place of the Sharpe ratio, with similar purpose of ranking investments.
From Investopedia.com we have the following formula: The Sharpe ratio's numerator is the difference over time between realized, or expected, returns and a benchmark such as the risk-free rate of return or the performance of a particular investment category. Its denominator is the standard deviation of returns over the same period of time, a measure of volatility and risk.
We use the concept of the Sharpe ratio but redefine it in the Forward Portfolio Dashboard. We use target returns, based on either the aggregate average of professional analysts, plus dividends expected over the next year to define a target one year return, or we use our own proprietary ML modeling to forecast the stock price one year ahead and add dividends (at current rates) to define the one-year target return. Instead of historical standard deviations, we use forward looking investment volatility which is based up on options approximately one year out. So, we have our basic Sharpe ratio model based on the analyst’s target returns over the implied forward volatility or our ML based Sharpe ratio based on the same volatility measure but with our own predicted stock price. We do not guarantee our stock price forecast will be correct. In fact, we can guarantee that in most cases it will be wrong and 50% of the time or more it will likely be high.
Portfolio Sharpe Ratios
One can calculate a Sharpe style ratio for a portfolio and the more negatively correlated the investments in the portfolio the lower will be the overall volatility, so we should expect portfolio return to risk metrics to be better than that of individual stocks.
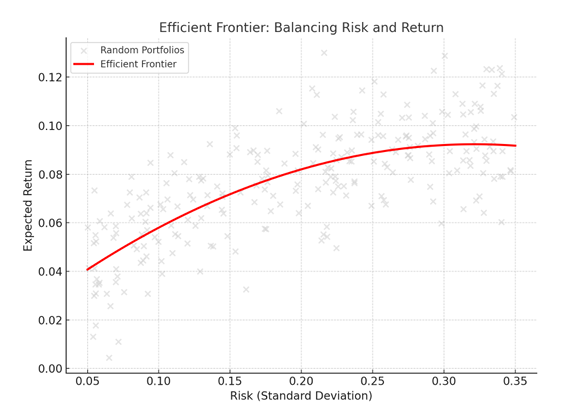
Mean Variance Portfolio Analysis: Once an account user has filtered a list of stocks down to a subset based on filters discussed separately, we provide a set of portfolios (low, medium, high risk) based on the classic mean variance approach first developed by Harry Markowitz. Many call this “MPT” for modern portfolio theory. It has been advanced and improved over the years by Sharpe, Ross, Roll, and others. From Investopedia, we have the following discussion: “The modern portfolio theory (MPT) is a practical method for selecting investments in order to maximize their overall returns within an acceptable level of risk. This mathematical framework is used to build a portfolio of investments that maximize the amount of expected return for the collective given level of risk. American economist Harry Markowitz pioneered this theory in his paper "Portfolio Selection," which was published in the Journal of Finance in 1952. He was later awarded a Nobel Prize for his work on modern portfolio theory. A key component of the MPT theory is diversification. Most investments are either high risk and high return or low risk and low return. Markowitz argued that investors could achieve their best results by choosing an optimal mix of the two based on an assessment of their individual tolerance to risk.
More than just naïve diversification, Markowitz argued that if we could find company stocks that were not correlated with one another, we could reduce aggregate portfolio risk. In theory, if one can find two companies that are perfectly inversely correlated (negative 1.0 correlation coefficient) then the portfolio risk could be brought down to zero volatility, since we could invest just the right proportion into each stock such that when one went up the other went down and vice versa. In real life, such combinations do not exist, but there are many combinations where a correlation coefficient of less than 1.0 exists and these can be exploited in a more sophisticated diversification strategy. For example, an airline stock might do better next year than oil company stocks, but if oil prices surge the airline’s costs will be higher and the airline stock will do worse, even when the oil company does well. So, in combination, the airline company and the oil company will have a lower portfolio risk, than either would on its own, and this is the essence of MPT.
For our application of MPT we use the implied volatilities based on forward looking options instead of historical variance, whenever possible, and we use the forecast trend in the correlation using a modern statistical method such as error correction models, or other auto regressive models. That is, the concept of diversification is the same as with MPT, but we use forward looking measures to generate a covariance matrix and a portfolio that achieves target returns. We also acknowledge that one of the short comings of MPT is that the correlations are not always stable and that volatilities may change over time, so one should use MPT with a degree of caution. One might also use Sharpe ratios to select a portfolio or other criteria that match the investor objectives.
Within the portfolio generated, we do not allow short positions, and we limit the maximum allocation to any one stock to 10% by default. The user might want to limit the allocation to something lower.
Portfolio Sharpe Ratios will be wrong
There are several reasons why expected Sharpe ratios will be wrong. First the target return has a range, and the actual result could be higher or lower than the expected base case. Second, the expected volatility will be wrong, and the actual result could be higher or lower than expected. Third, the expected correlations between stocks returns or ETF returns will be wrong and if they are more correlated than expected, the overall risk will be more than expected. In fact, the minimum risk portfolios as generated within IAD will likely understate the aggregate portfolio risk because they assume that the forecast correlations will be correct, thus achieving ideal diversification strategies. While our calculations are mathematically correct, the minimum risk portfolio is our best guess of the best combination of stocks to minimize volatility in aggregate. Thus, the way to view portfolios at higher return levels is on a relative basis. Higher return and risk portfolios are exactly that, higher risk, but the lowest risk portfolio and all that follow will be off to the extent the forward-looking correlations are wrong. Our advice is to be especially careful with assuming the lowest risk portfolios will be as stable as our aggregate volatility calculations suggest.
We tend to observe during economic downturns that stock returns that are historically counter cyclical will move together. That is, during a deep recession, most company stock prices will be correlated. For all of these reasons, one must not expect the volatility nor returns to be accurate. At the same time, the return and risk parameters generated from this analysis do provide an excellent indication of relative risk and return. A portfolio with an expected return of 10% and a volatility measure of 5% is clearly less risky than one with a 10% expected return and 15% volatility.
Implied Volatility
We use the implied volatility from forward looking options about one year out for this measurement. If a stock has no options trading, then we either do not include it or use the historical standard deviation of total returns for that stock. Note that portfolios will tend to have lower implied volatilities than individual stocks, based on the diversification provided strategically based on the covariance matrix, but actual portfolio volatilities are often higher than expected simply as a result of unforeseen events. Beyond general diversification the only way to reduce risk further is to use hedging strategies, using options.
Forecast Total Returns
We use the expected price one year out plus dividends to generate a ‘target expected return”. If the target returns are negative for any particular stock then we filter it out such that the S&P 500 will be less than 500 stocks and so forth.
Return to Risk Ratio
We use the target expected return over the implied volatility for this measure, as discussed earlier.
Current PE Ratio
This is the current stock price over the current stated earnings.
Dividend Yield in Percent
This is the annualized dividends, if any, over the current stock price.
Market Cap Size
This is the sum of the value of all stock, whether traded or not, at current prices times the number of shares outstanding. A small cap company would generally be one worth less than $2 billion, a medium or mid-cap company is one between $2billion and $10 billion in value and a large cap is $10 billion and up. There are also some mega cap companies that can move the market. At present within the US these are Apple (AAPL), Microsoft (MSFT), Amazon (AMZN), Alphabet (GOOG), Facebook or Meta (FB), NVIDIA (NVDA), and Eli Lilly (LLY). Berkshire Hathaway is also considered a very large cap company(BRK.A) but it is a holding company that owns other companies, so it is more like a portfolio of companies, most of whom are large cap.
Prices above 200 day moving average
Stock prices can be viewed relative to their historical trend. If a stock is above it’s 200 day moving average then one can check this filter. In this case, the price is relatively high or moving up compared to the last 200 days. This is considered a technical filter as opposed to a fundamental filter, such as price to earnings.
ETF filter
Stocks are organized by industry focus in a variety or Exchange Traded Funds. For example, XLE is only energy stocks and SPY is the S&P 500. One can filter based on some of the ETFs out there to focus on a particular industry group.
Index filter
This is based on the stock exchange such as the New York Stock Exchange NYSE) or the NASDAQ.
Allocation Min and Max
We set the minimum allocation to any one investment at 2% and the maximum at 20%. A 20% maximum allocation could result in as few as 5 stocks. A 2% minimum will result in as many as 50 stocks, although a much smaller number is likely. If anyone has such a small minimum, they will certainly generate a very diverse portfolio, but it will not likely be the best portfolio possible in terms of aggregate portfolio risk. Typically, we will observe portfolios of 5 to20 stocks when we allow the portfolio to minimize the overall expected risk at any given return target. For lower risk portfolios there tends to be fewer stocks using the mean variance (Markowitz) model because of reliance on negatively correlated stock returns which are harder to identify. Stated another way,80% of all stocks are correlated with the general economy and some will react more to changes in interest rates, while others react more to energy prices and these differences give rise to being able to select better diversification strategies.
Subset Allocation Analysis
One might want to allocate a certain proportion of a portfolio to a sector such as energy or tech or real estate, and then within that sector to pick the best stocks. For example, rather than invest in all the energy stocks in one ETF such as XLE with approximately 42 stocks, one could pick out the best 20 of these using the Sharpe Ratios as a filter for these 42 stocks and then go one step further and generate a portfolio of the best 20, ending up with 10 to 15. In this way, one can achieve allocation to an ETF but very likely with some of the best stocks within the ETF instead of the entire set.
Generate portfolio calculations and default maximum allocations
Using the expected target returns, correlation estimates and implied volatility, we generate a portfolio that will reduce the expected aggregate risks at any given target return. The allocations are constrained based on the maximum of 10% default or as set by the user.